Model
Research Question: How does the risk of heart disease vary across different age groups and between genders?
Context
Heart disease remains the leading cause of death globally, with age and gender being two of the most significant factors influencing its development. The likelihood of heart disease increases with age, and there are notable differences in risk between males and females. Understanding how these factors interplay is crucial for both unraveling the complexities of heart disease and enhancing preventive measures. By utilizing data modeling techniques, we can visualize and analyze how variations in age and gender contribute to heart disease risk. This approach helps reveal underlying patterns and relationships, supporting the development of more effective prevention strategies and informing public health initiatives aimed at reducing heart disease incidence.
Age + Gender vs Heart Disease
To assess which factor—age or gender—has a greater impact on the risk of heart disease, a Logisitic Regression model can be constructed. This model will enable an analysis of how each factor influences the likelihood of developing heart disease, offering insights into their relative contributions and helping to identify the most significant predictors.
1. Logistic Regression Model
The logistic regression model is given by:
\[ \log \left( \frac{1 - p}{p} \right) = \beta_0 + \beta_1 \cdot \text{Age Category} + \beta_2 \cdot \text{Gender} + \epsilon \]
2. Table
Interpreting the Coefficient Table
| Characteristic | Beta | 95% CI |
|---|---|---|
| Intercept | -5.72 | -5.93, -5.52 |
| Gender (Male) | 0.68 | 0.65, 0.71 |
| Age 25-29 | 0.39 | 0.11, 0.66 |
| Age 30-34 | 0.81 | 0.56, 1.06 |
| Age 35-39 | 1.02 | 0.79, 1.26 |
| Age 40-44 | 1.46 | 1.23, 1.68 |
| Age 45-49 | 1.95 | 1.73, 2.16 |
| Age 50-54 | 2.33 | 2.12, 2.54 |
| Age 55-59 | 2.78 | 2.57, 2.98 |
| Age 60-64 | 3.07 | 3.87, 3.28 |
| Age 65-69 | 3.31 | 3.10, 3.51 |
| Age 70-74 | 3.61 | 3.40, 3.81 |
| Age 75-79 | 3.87 | 3.67, 4.08 |
| Age 80+ | 4.14 | 3.93, 4.34 |
CI = Confidence Interval
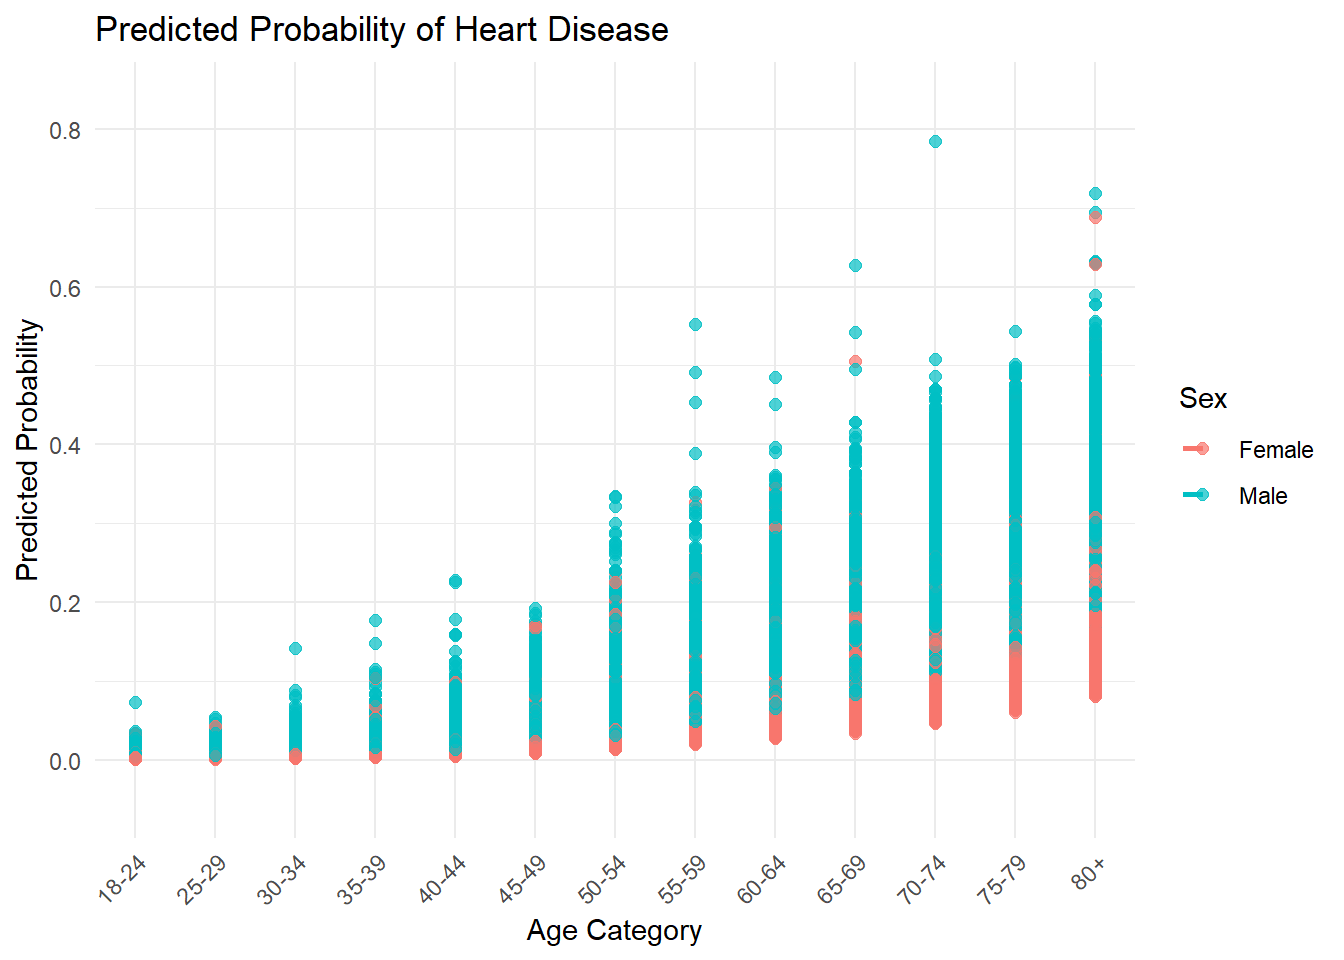
3. Model of Posterior Prediction (Age + Gender)
Implications of the Graph on Heart Disease Risk:
- Age as a Risk Factor:
- The graph likely shows a positive relationship between age and the predicted probability of heart disease. This means that as individuals get older, their likelihood of developing heart disease increases. This is important for public health awareness: older adults should be particularly vigilant about heart disease risk factors (e.g., cholesterol levels, blood pressure, lifestyle choices).
- Gender Differences in Risk:
- If the graph indicates differing probabilities of heart disease between males and females in the same age categories, it suggests that gender plays a significant role in heart disease risk. For instance:
- If males show higher predicted probabilities than females at certain ages, it indicates that men might need to engage more urgently in preventive measures (e.g., regular medical check-ups, lifestyle changes).
- Conversely, if women’s predicted probabilities rise sharply post-menopause, it emphasizes the need for increased awareness and prevention strategies for older women.
- If the graph indicates differing probabilities of heart disease between males and females in the same age categories, it suggests that gender plays a significant role in heart disease risk. For instance:
- Targeted Prevention Strategies:
- The information from the graph can inform targeted interventions and healthcare planning. For example:
- Older age categories might benefit from heart health screenings, education about symptoms of heart disease, and lifestyle modification programs aimed specifically at older adults.
- Public health campaigns could focus on raising awareness about heart disease risk among men in their 40s to 60s if those groups show higher probabilities.
- The information from the graph can inform targeted interventions and healthcare planning. For example:
- Understanding Risk Management:
- Those individuals and healthcare providers can use insights from the graph to prioritize interventions based on age and gender.
- Individuals who fall into higher-risk groups (e.g., older adults or males based on the trends observed) can be encouraged to adopt heart-healthy behaviors—such as maintaining a balanced diet, exercising regularly, managing stress, and monitoring their heart health closely.
- Implications for Screening and Early Detection:
- The visual data can promote a greater emphasis on regular screenings for heart disease in high-risk categories as indicated by the graph. Understanding that certain age groups have higher risks can motivate users to seek preventive care proactively.
- Societal Impact:
- Beyond individual implications, the data can inform public health policies and funding allocation towards heart disease research, education, and resources, particularly aimed at groups identified as having a higher predicted probability of developing heart disease.
Conclusion:
The graph ultimately serves as a critical tool in understanding how age and gender impact heart disease risk among individuals. By illustrating these predicted probabilities, it emphasizes the need for personalized risk assessment, prevention strategies, and early intervention to improve cardiovascular health outcomes across different segments of the population. Individuals, healthcare providers, and policymakers can all use this information to increase awareness and take proactive steps in managing heart disease risk.